MMULT Running Total
Previously, I showed you how to use the SCAN function to calculate the running total with a single formula. However, given only Office Insiders can access it right now, it’s probably not wise to use it in shared workbooks.
Thankfully, I have a solution that will work for most people. It involves MMULT, which I covered a couple of days ago.
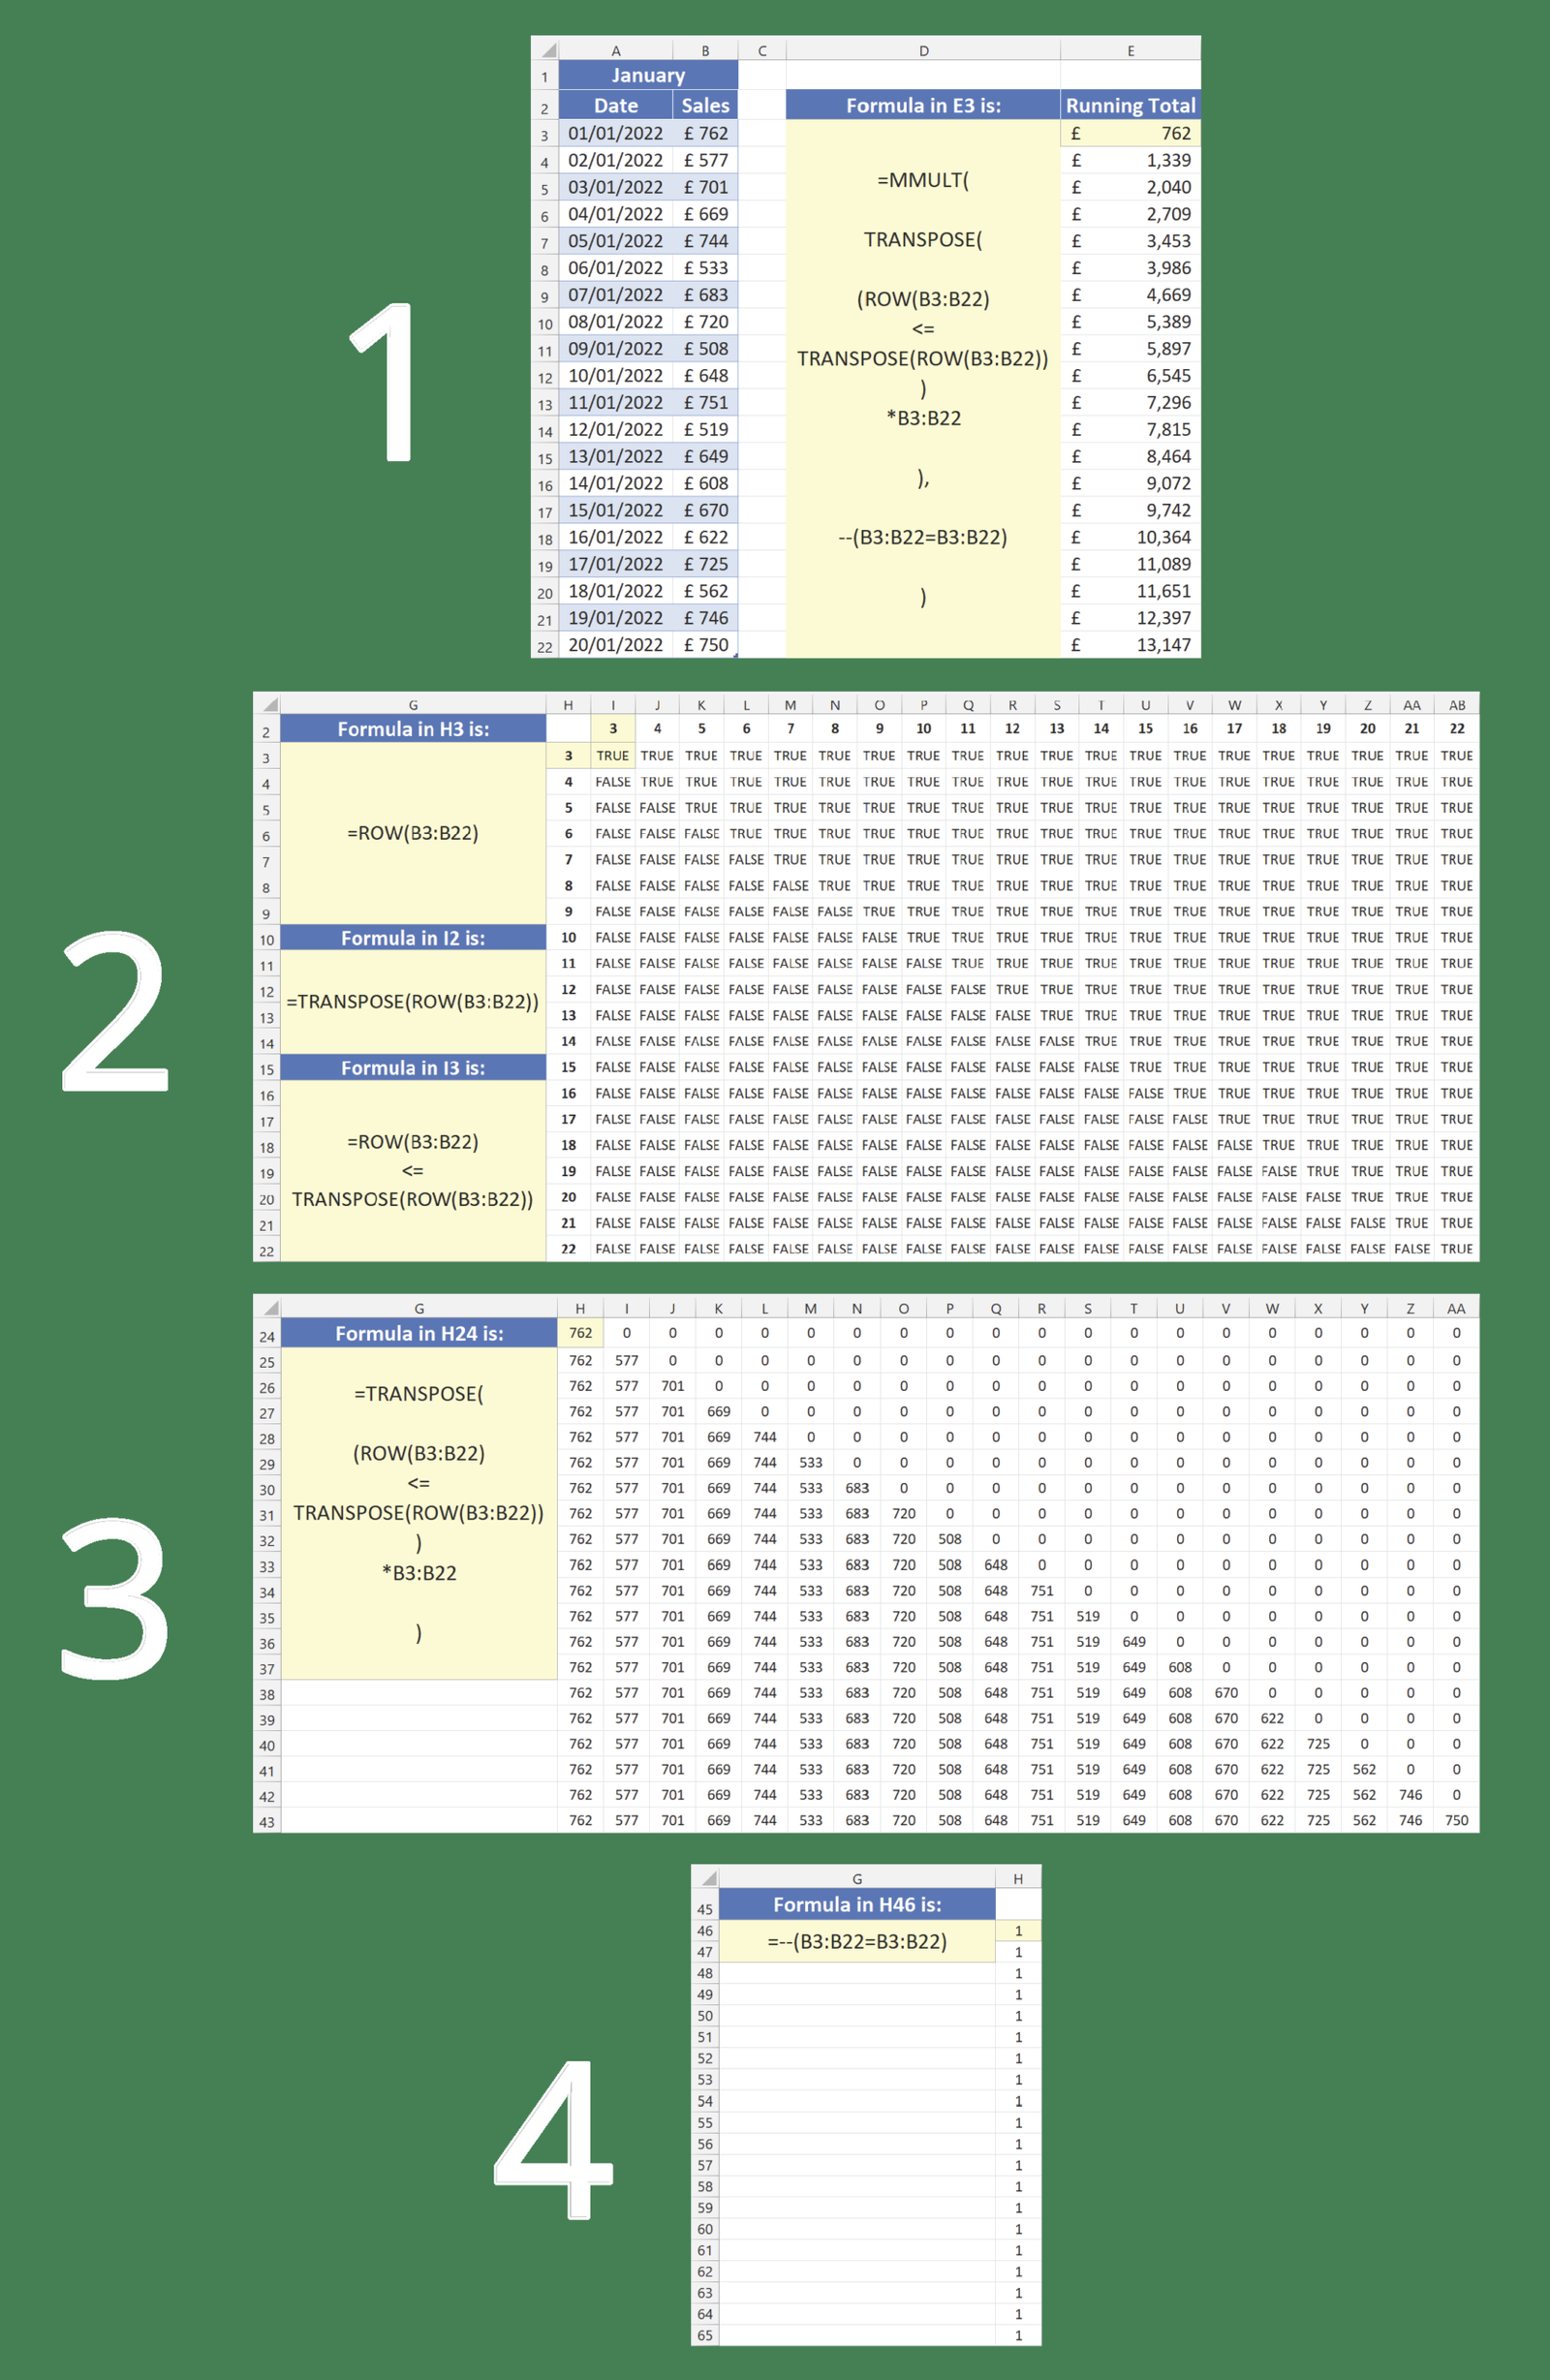
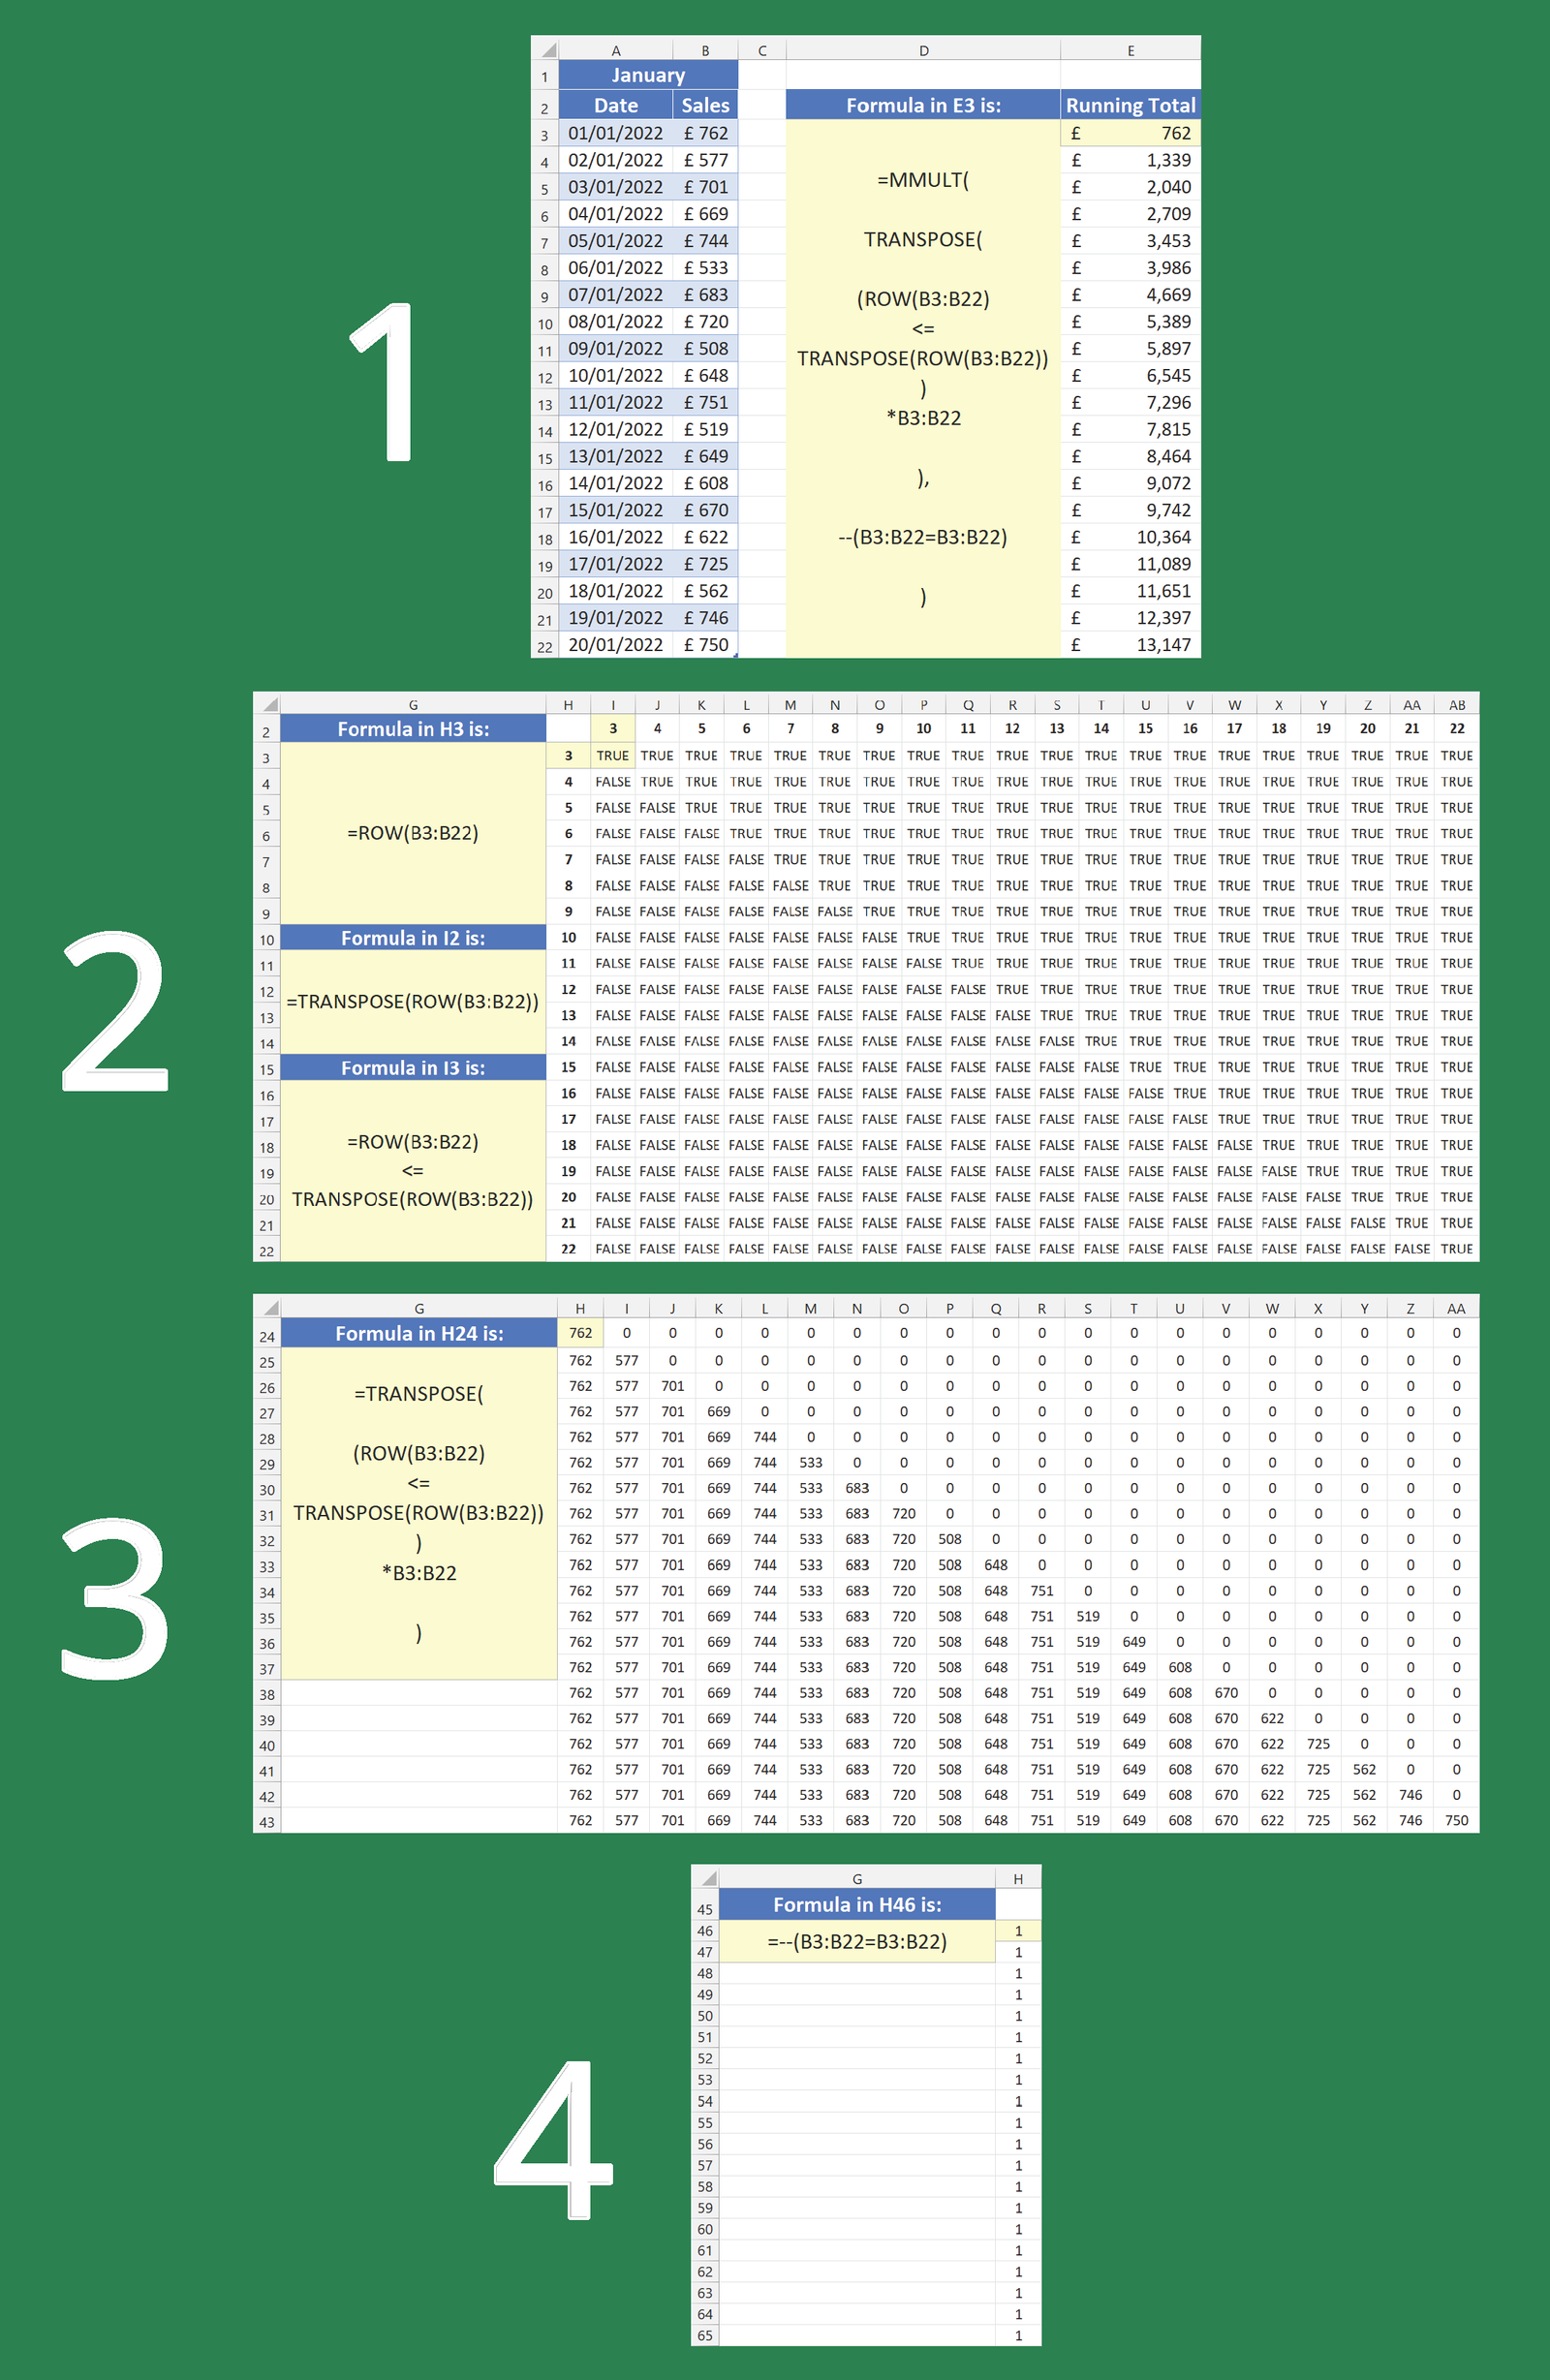
Image 1 features a table of sales data for the first 20 days of January 2022. Each Sales value is accumulated and returned under Running Total.
The formula breakdown is shown in images 2, 3 and 4.
Inside the MMULT array1 argument, a matrix is generated with incremental values displayed vertically and horizontally. A conditional statement checks to see whether each row is less than or equal to each column. For example, row 3 <= column 7 is TRUE and row 18 <= column 13 is FALSE. (Image 2)
Multiplying this matrix by the Sales column generates another. Here, the Sales figures and zeros replace the TRUE and FALSE values, respectively. However, it’s also necessary to transpose it so the numbers build up from the top downwards. (Image 3)
As the Sales column is equal to itself, it creates a column of ones in array2 (image 4), which are multiplied by the array1 values to return the running total.
The first few calculations are:
- (762 x 1 = 762) + (0 x 1 = 0)…repeated 18 more times = £762
- (762 x 1 = 762) + (577 x 1 = 577) + (0 x 1 = 0)…repeated 17 more times = £1339
- (762 x 1 = 762) + (577 x 1 = 577) + (701 x 1 = 701) + (0 x 1 = 0)…repeated 16 more times = £2040


