
- December 2024
- November 2024
- October 2024
- September 2024
- August 2024
- July 2024
- June 2024
- May 2024
- April 2024
- March 2024
- February 2024
- January 2024
- December 2023
- November 2023
- October 2023
- September 2023
- August 2023
- July 2023
- June 2023
- May 2023
- April 2023
- March 2023
- February 2023
- December 2022
- November 2022
- October 2022
- September 2022
- August 2022
- July 2022
- June 2022
- May 2022
- April 2022
- March 2022
- February 2022
- January 2022
- December 2021
- November 2021
- October 2021
- September 2021
- August 2021
- July 2021
- June 2021
- April 2021
- March 2021
- February 2021
- January 2021
- December 2020
- November 2020
- October 2020
- September 2020
- July 2020


| ID | Title 1 | Title 2 |
|---|---|---|
| Sample #1 | Row 1, Content 1 | Row 1, Content 2 |
| Sample #2 | Row 2, Content 1 | Row 2, Content 2 |
| Sample #3 | Row 3, Content 1 | Row 3, Content 2 |

Combining Tables
Combining tables has been notoriously difficult in Excel. In November 2020, I wrote an article called ‘Combining Multiple Excel Tables into One’, which demonstrated several methods that were clunky, cumbersome, and inflexible. There was no alternative. Thankfully, 17 months on…
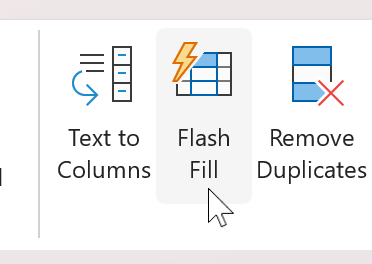
How to Use Flash Fill in Excel
Flash Fill is an Excel feature that intelligently spots patterns in your data to fill a range of cells. It can be used for things like: The process is: As an alternative to step 2, type a second entry for…

Highlight Row Blocks in Excel
Excel Tables has a Banded Rows option that highlights rows in alternating colours. This enhances readability by making it easier to differentiate between them. What if you wanted to highlight blocks of rows though? A conditional formatting rule combining the…

Consolidate Data with 3D References
3D references provide a simplified way of aggregating data by referring to the same cell or range across multiple worksheets. Say you had monthly sales figures stored in separate worksheets and wanted to summarise them. You might be tempted to…

Percentage Examples
Percentages are calculated for many things, such as interest rates, income tax, profit margins, restaurant bills, and possession in football matches. There are three main percentage calculations; each is shown in the document. Percentage of Total (Page 1) The exam…

How to Copy the Excel Status Bar Statistics
Excel’s status bar shows various statistics based on the values in the selected cell range (e.g. sum, average, max and min). Right-clicking on it opens the Customize Status Bar menu where you can choose what is featured. Microsoft stealthily snuck…
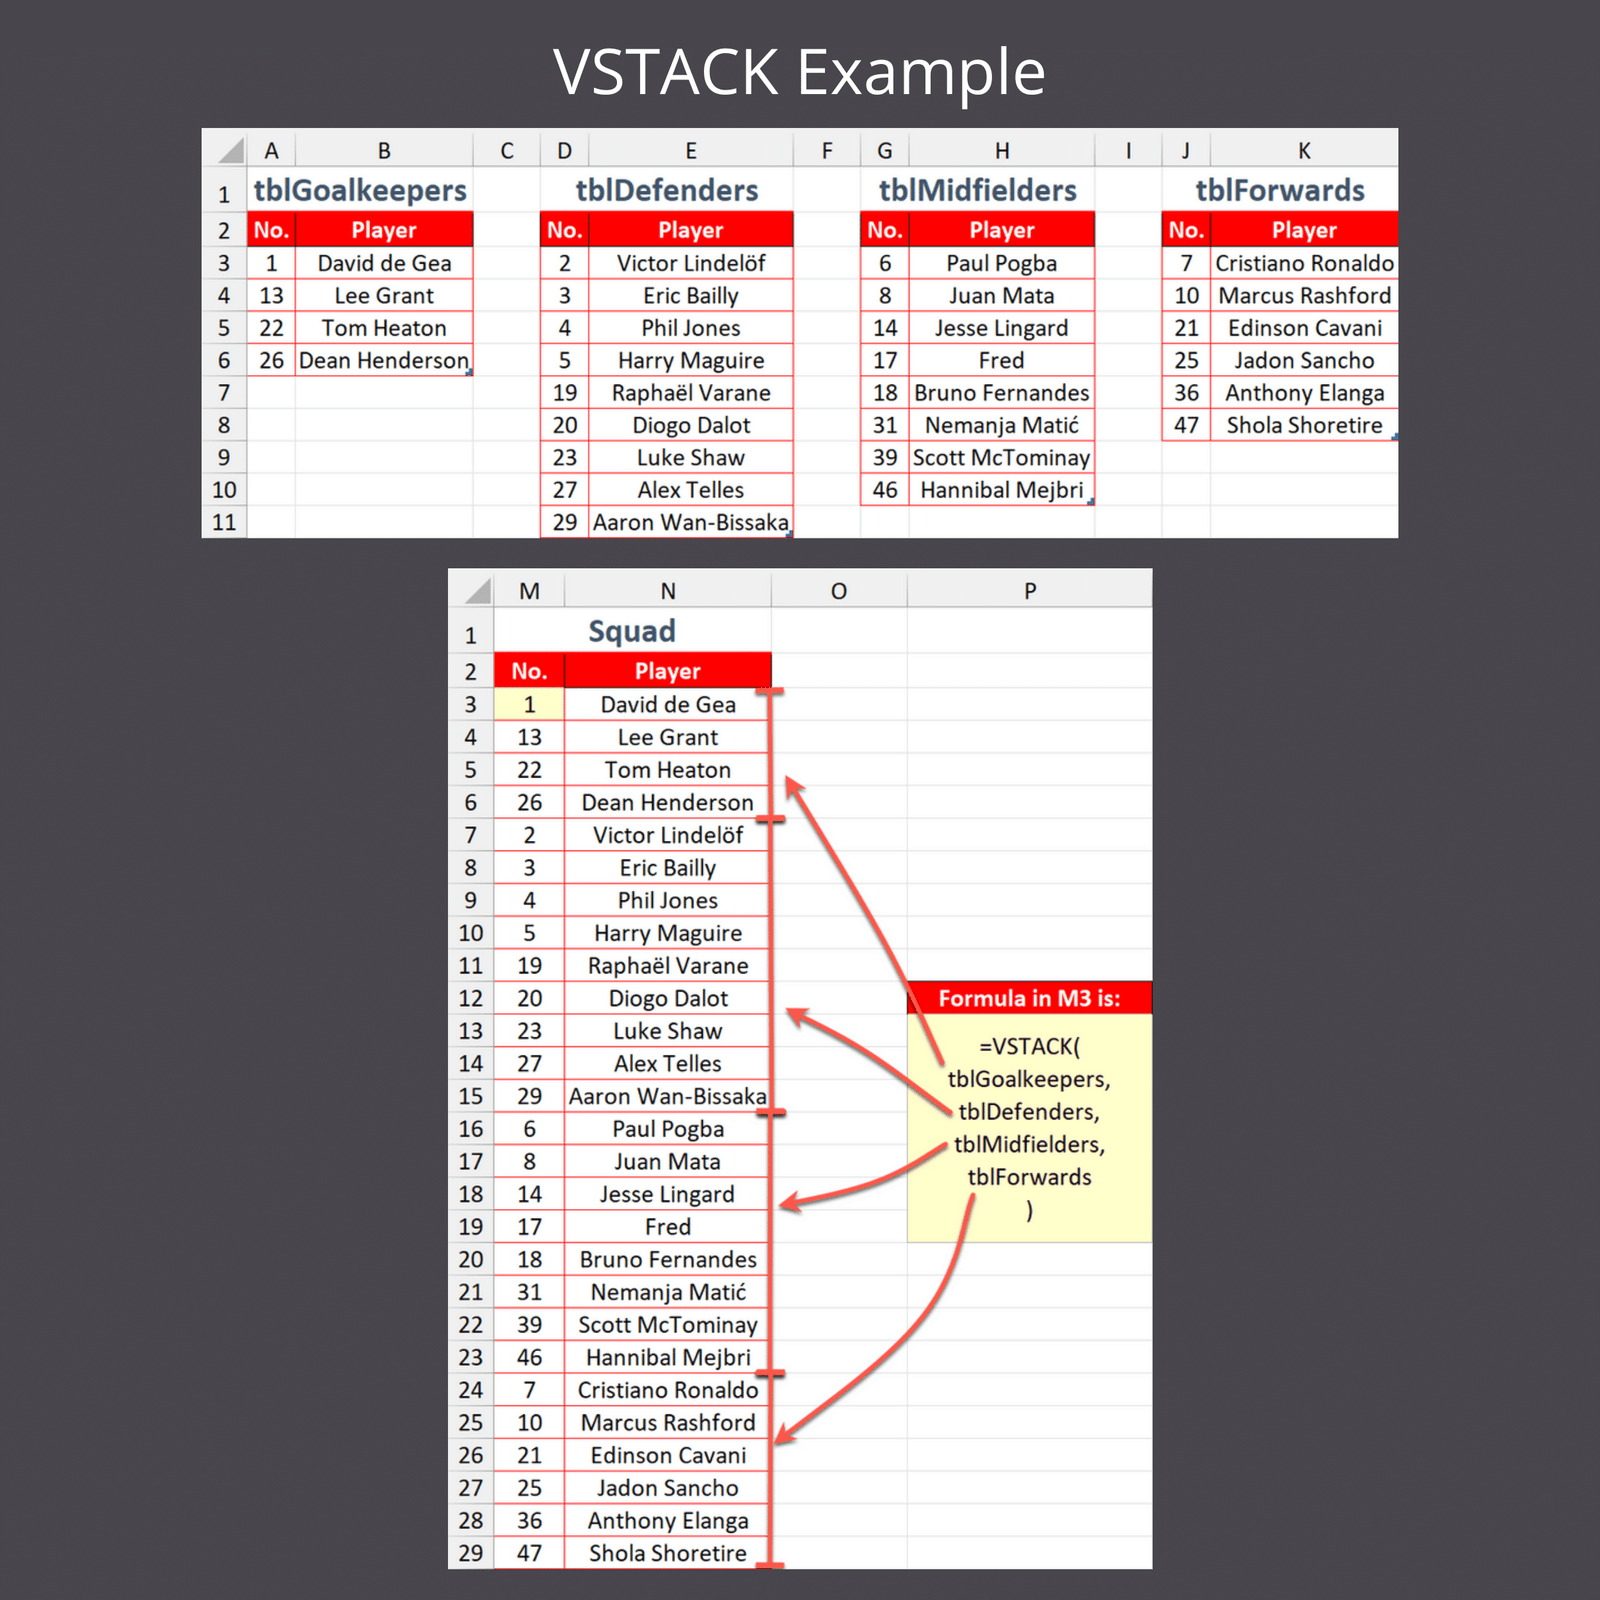
Combining tables has been notoriously difficult in Excel. In November 2020, I wrote an article called ‘Combining Multiple Excel Tables into One’, which demonstrated several methods that were clunky, cumbersome, and inflexible. There was no alternative. Thankfully, 17 months on…
Flash Fill is an Excel feature that intelligently spots patterns in your data to fill a range of cells. It can be used for things like: The process is: As an alternative to step 2, type a second entry for…
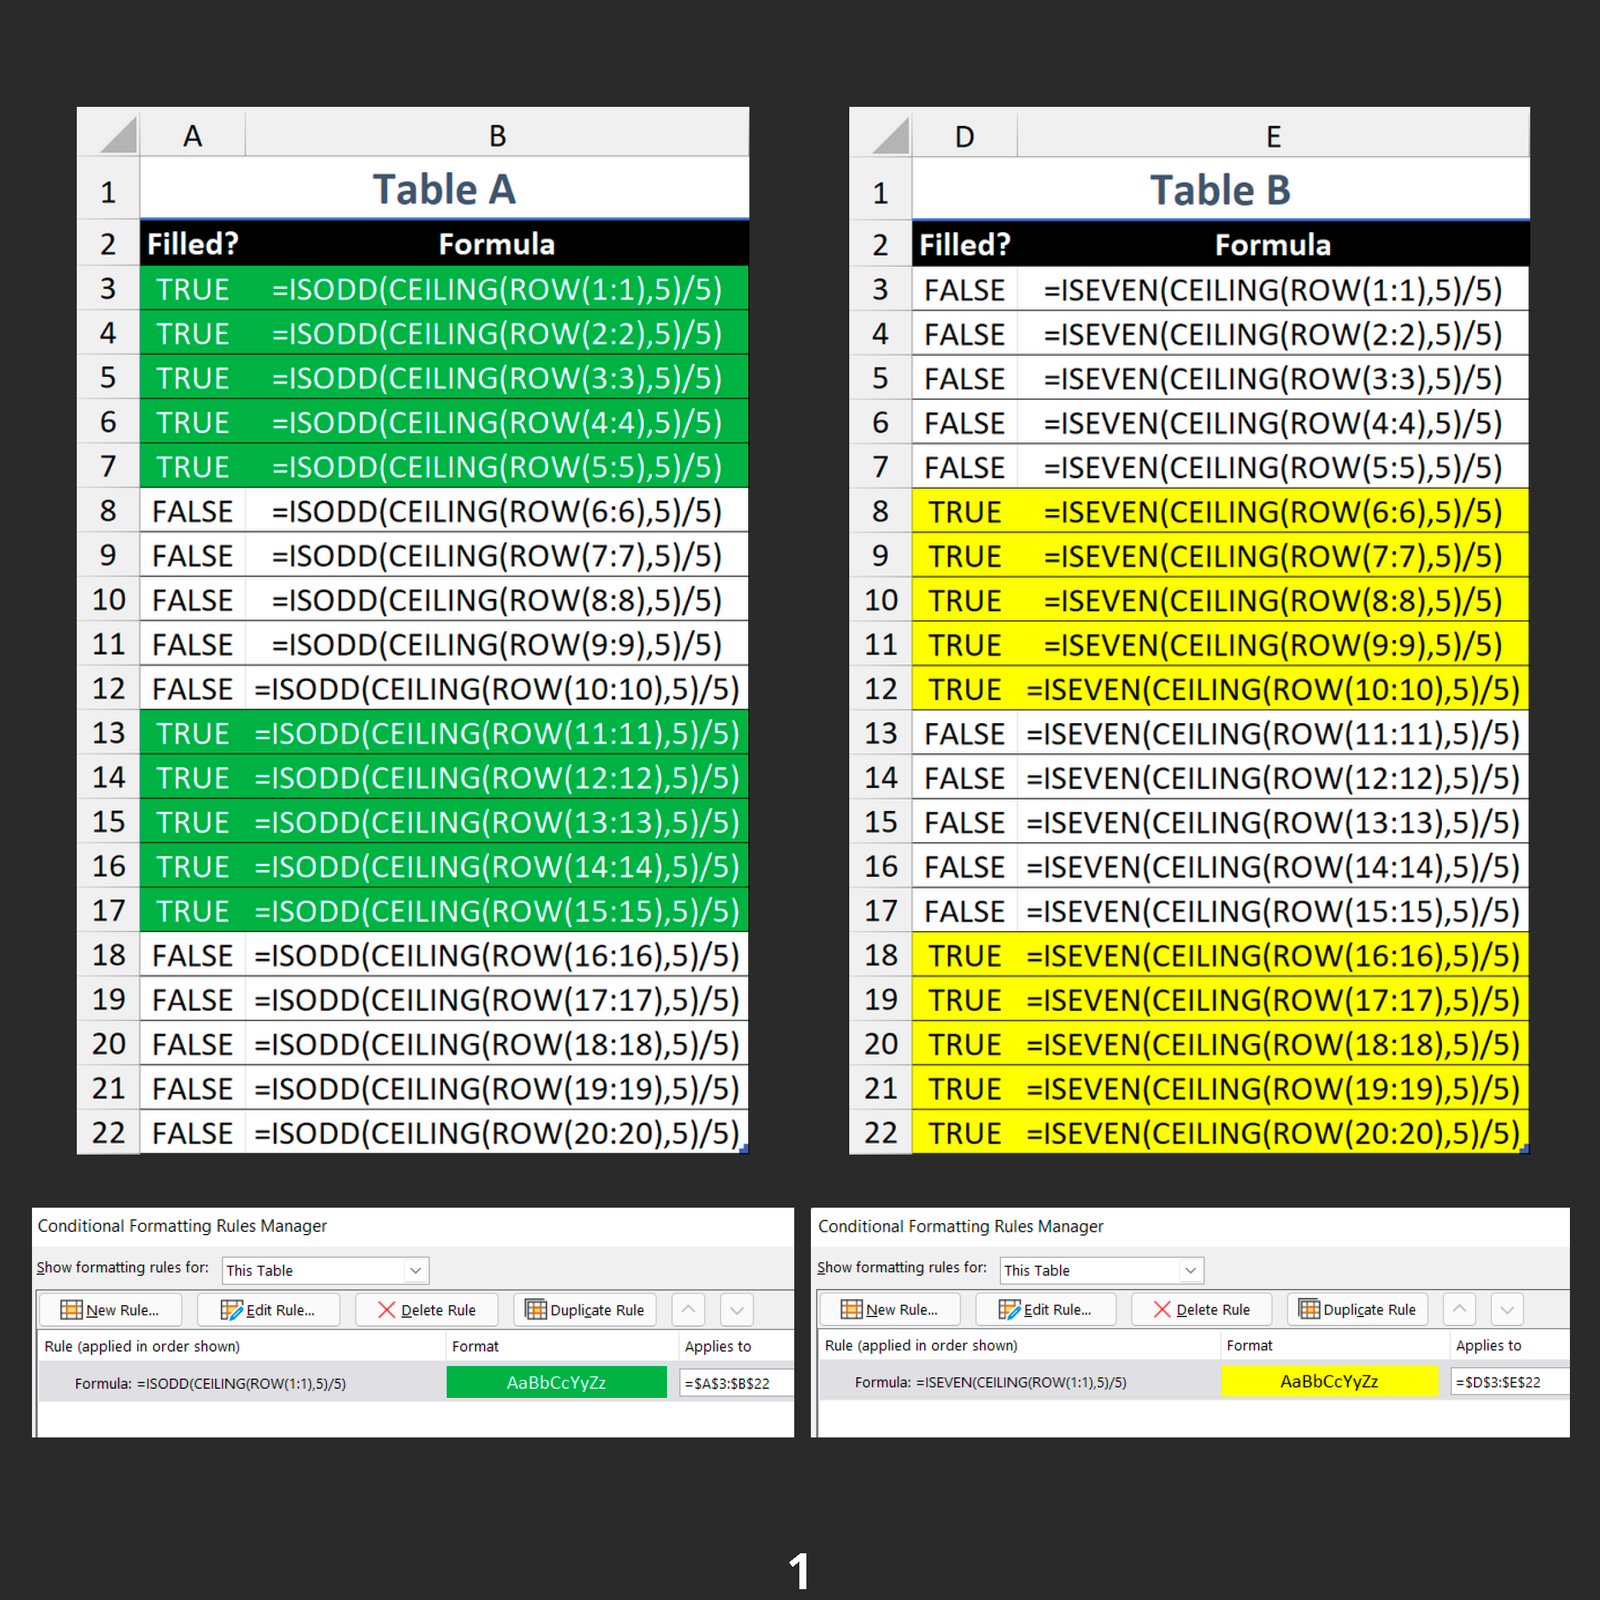
Excel Tables has a Banded Rows option that highlights rows in alternating colours. This enhances readability by making it easier to differentiate between them. What if you wanted to highlight blocks of rows though? A conditional formatting rule combining the…
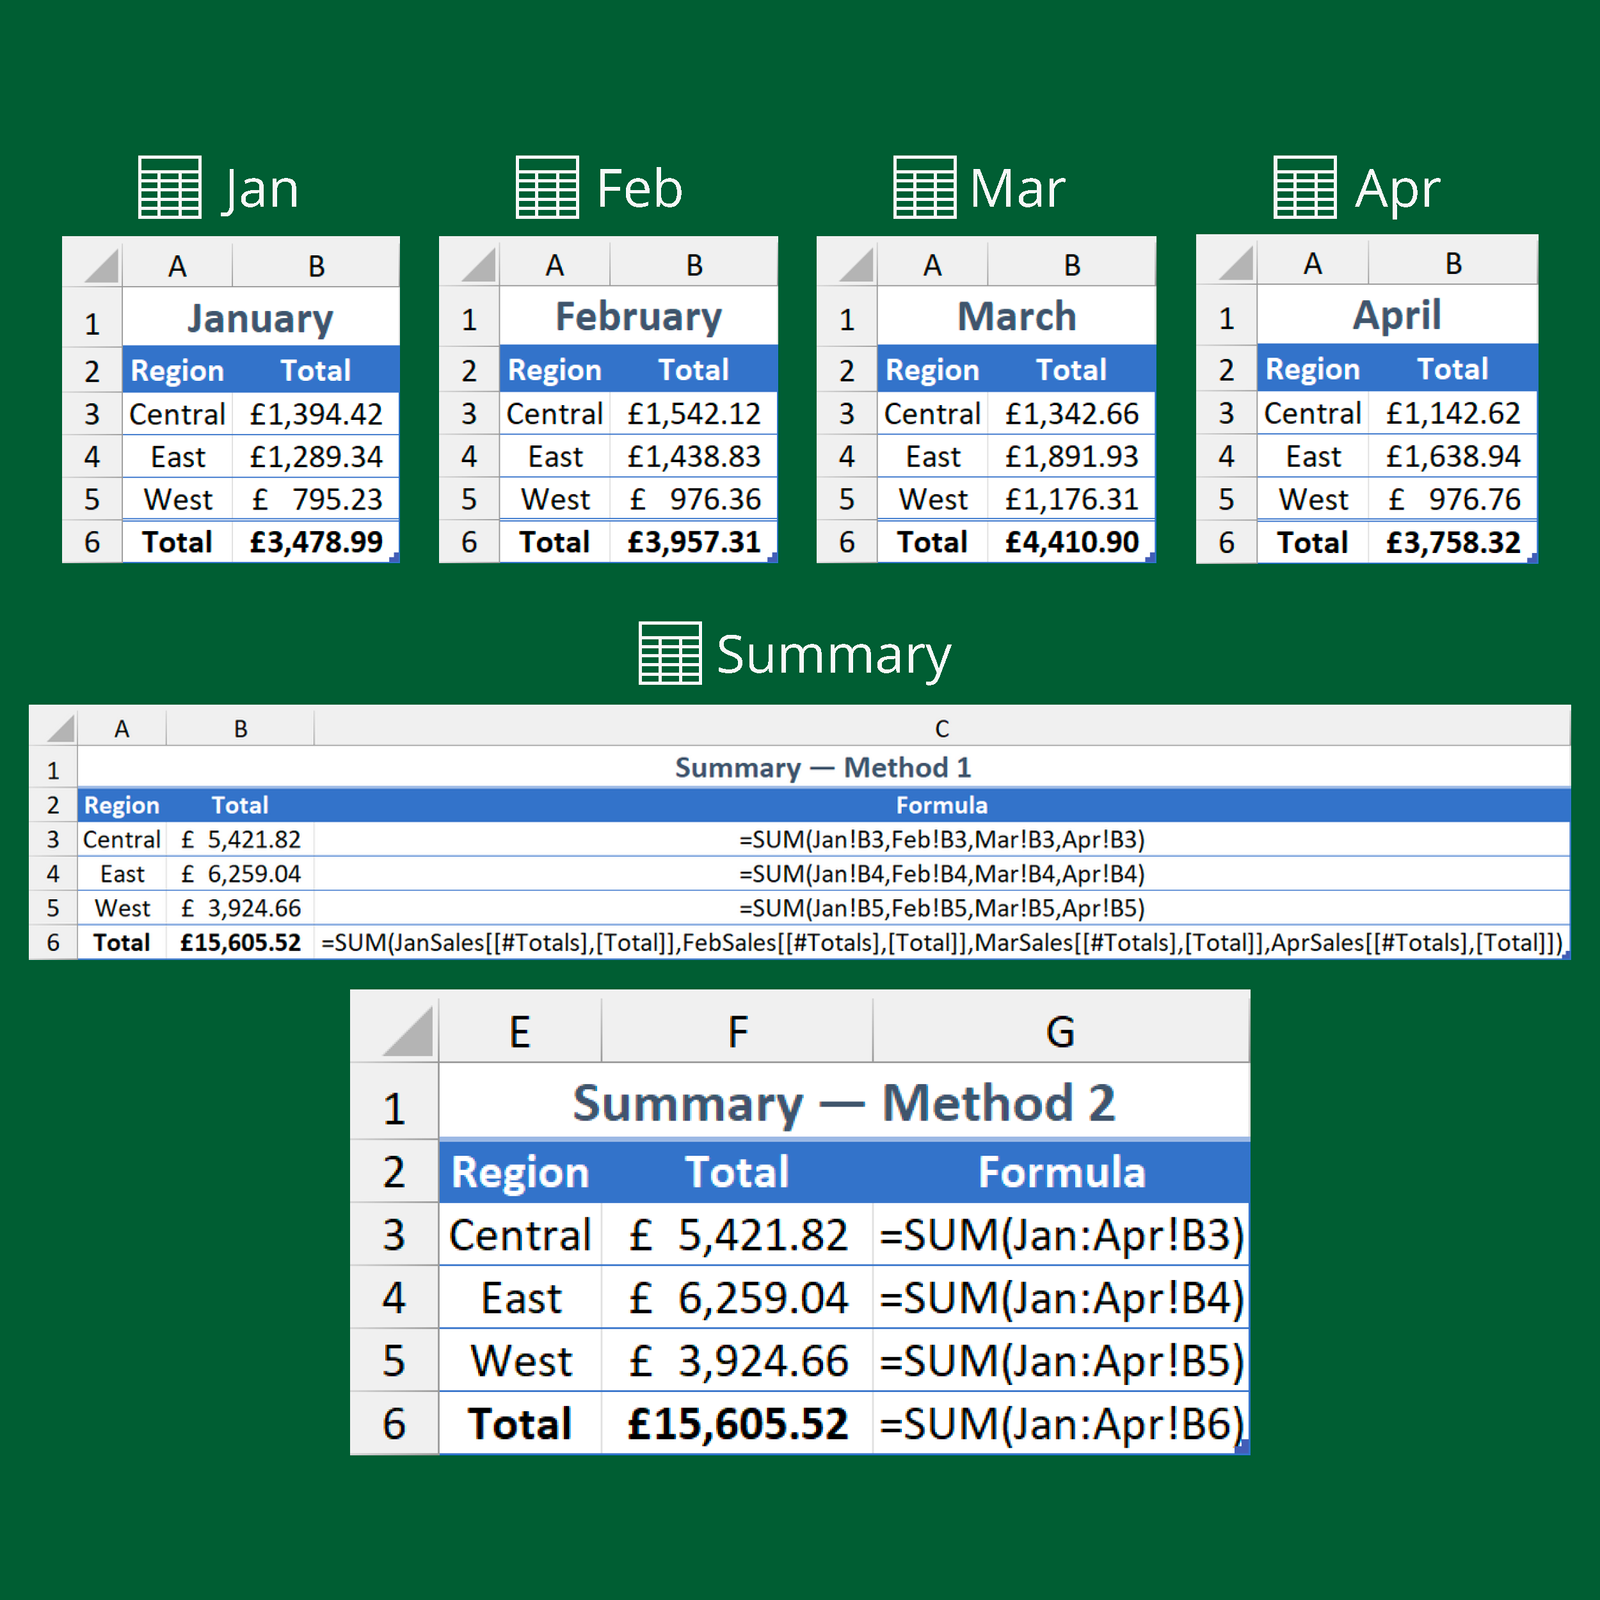
3D references provide a simplified way of aggregating data by referring to the same cell or range across multiple worksheets. Say you had monthly sales figures stored in separate worksheets and wanted to summarise them. You might be tempted to…
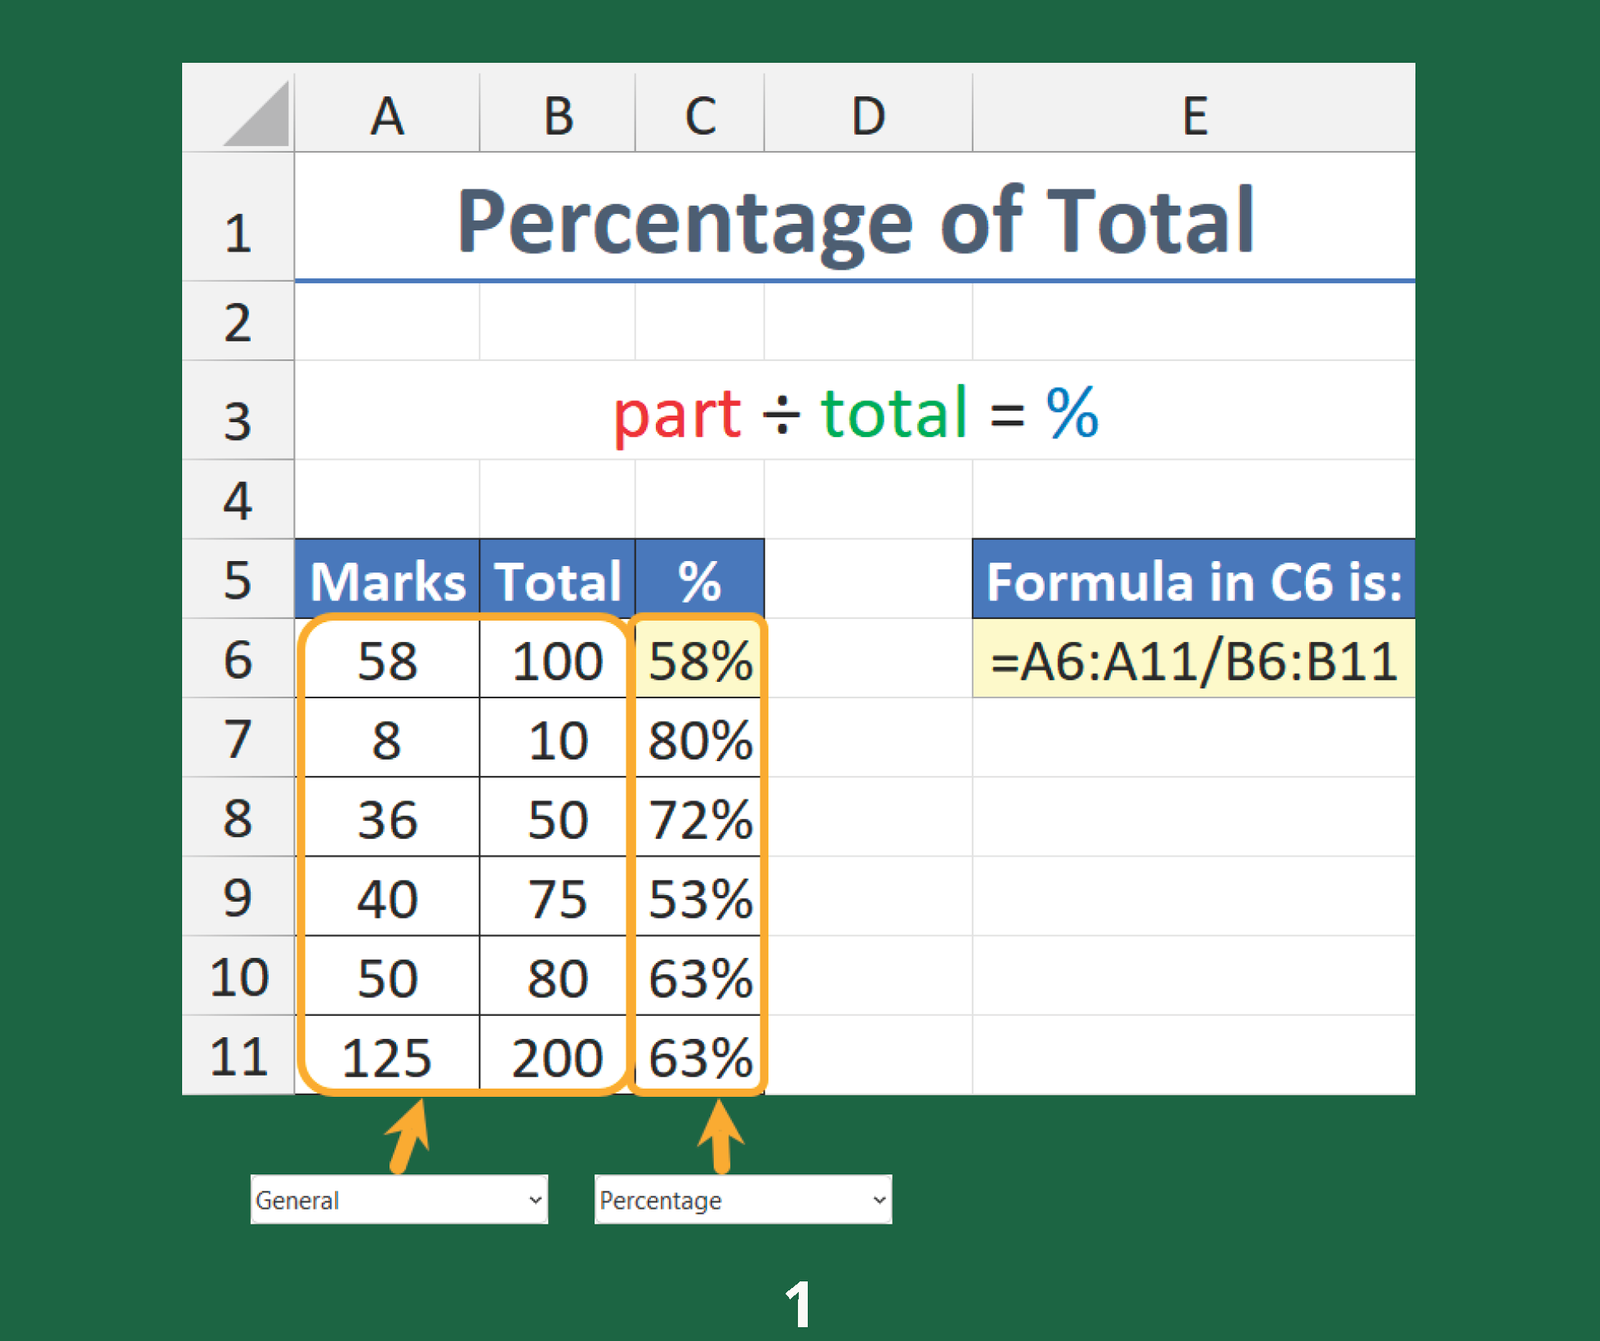
Percentages are calculated for many things, such as interest rates, income tax, profit margins, restaurant bills, and possession in football matches. There are three main percentage calculations; each is shown in the document. Percentage of Total (Page 1) The exam…
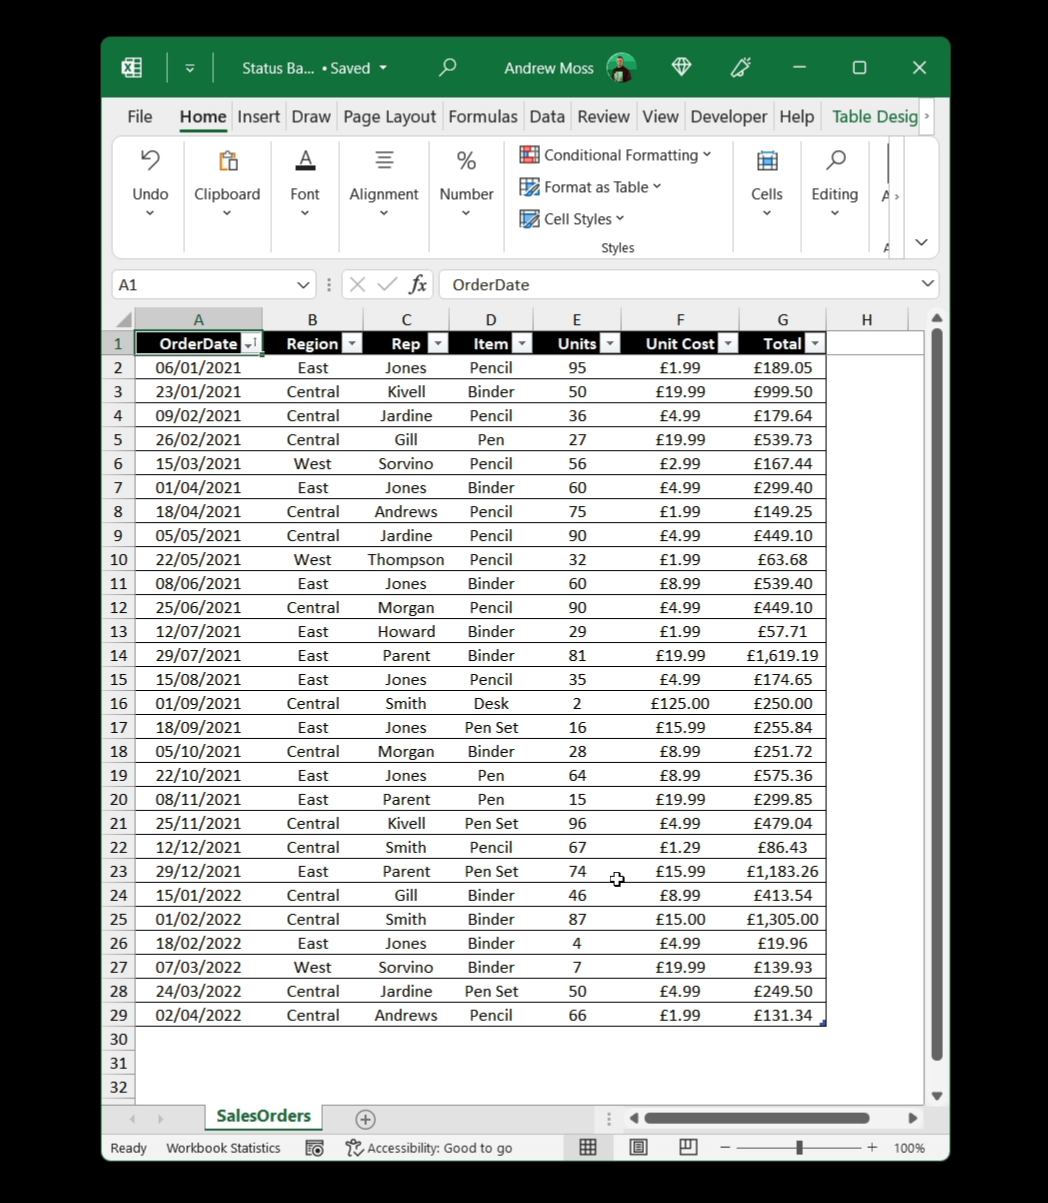
Excel’s status bar shows various statistics based on the values in the selected cell range (e.g. sum, average, max and min). Right-clicking on it opens the Customize Status Bar menu where you can choose what is featured. Microsoft stealthily snuck…