
A clearer way to read supermarket market share

Earlier today, I read the BBC InDepth article, ‘Asda has lost its mojo and has a big fight to get it back’.

Halfway down, I saw a slope chart visualising its declining market share compared to the other major UK supermarkets: Tesco, Sainsbury’s, Aldi, Morrisons, and Lidl.
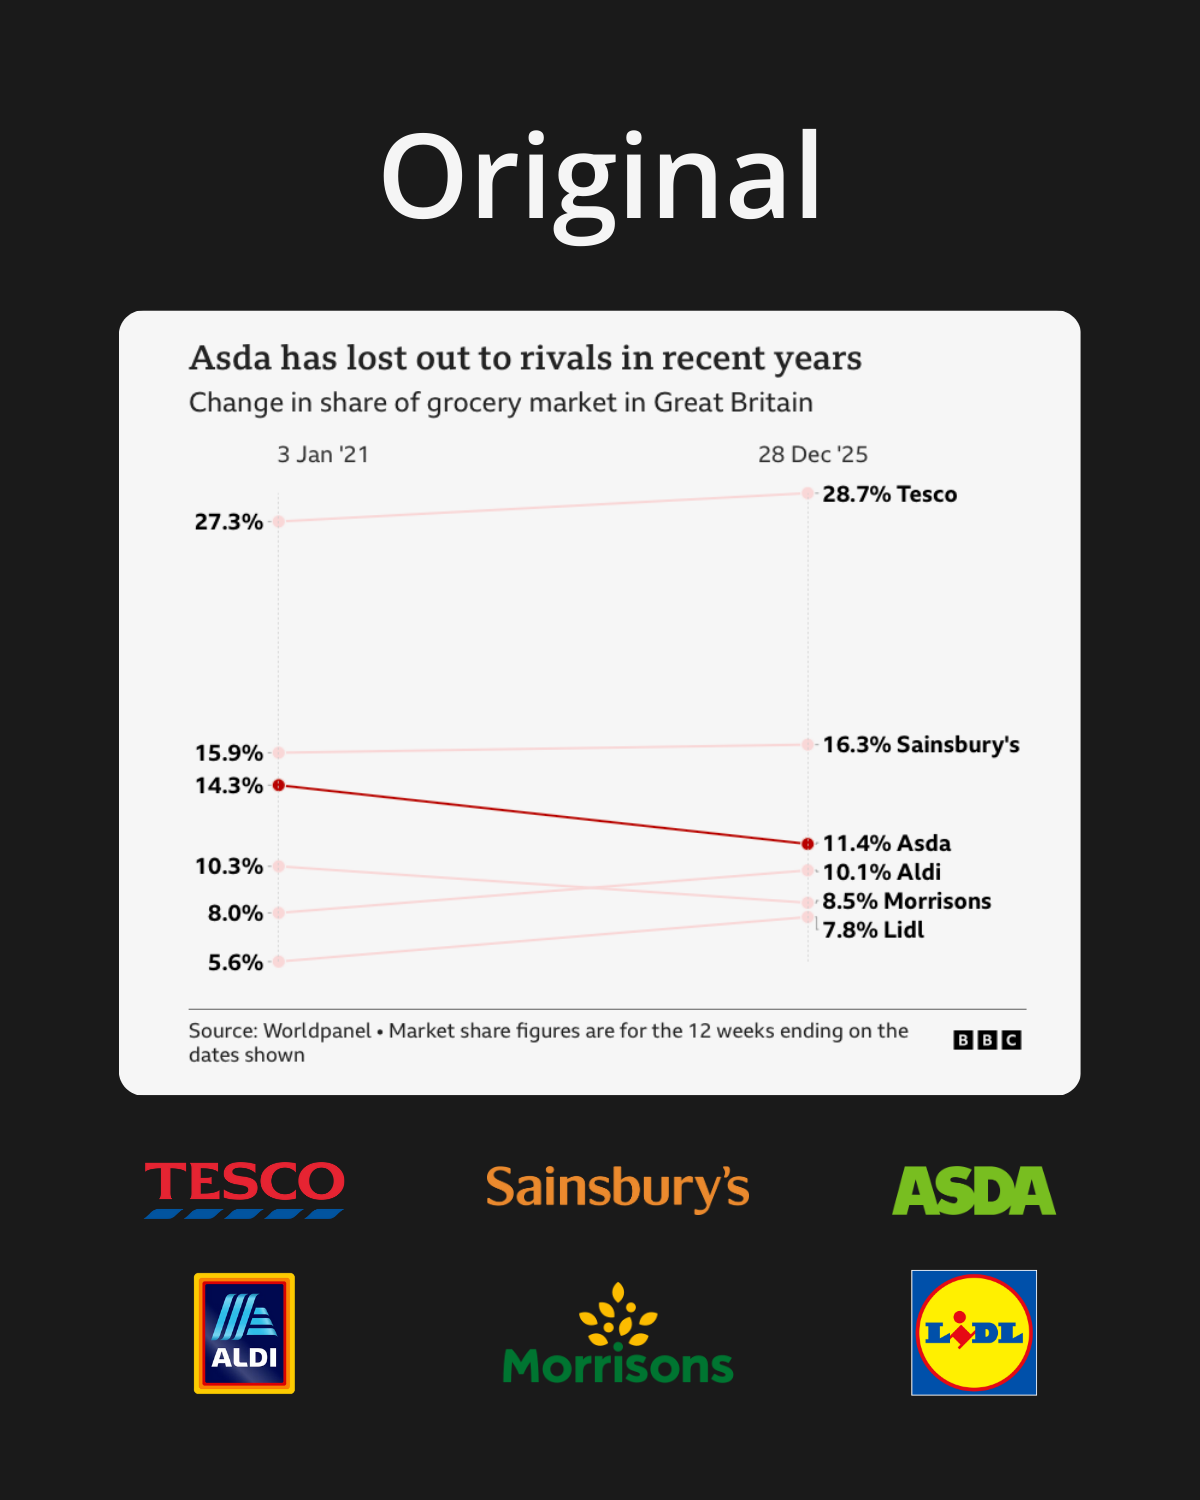
After a few seconds of digesting it, it became apparent what the problems were:
- Each line is red, with Asda’s shown at a much higher opacity than the other five.
- The labels are the same colour on both sides (black).
I tried generating alternatives in ChatGPT first, but it got a bit funny about recreating charts with brand names in. Gemini was more tolerant, so I used that instead.
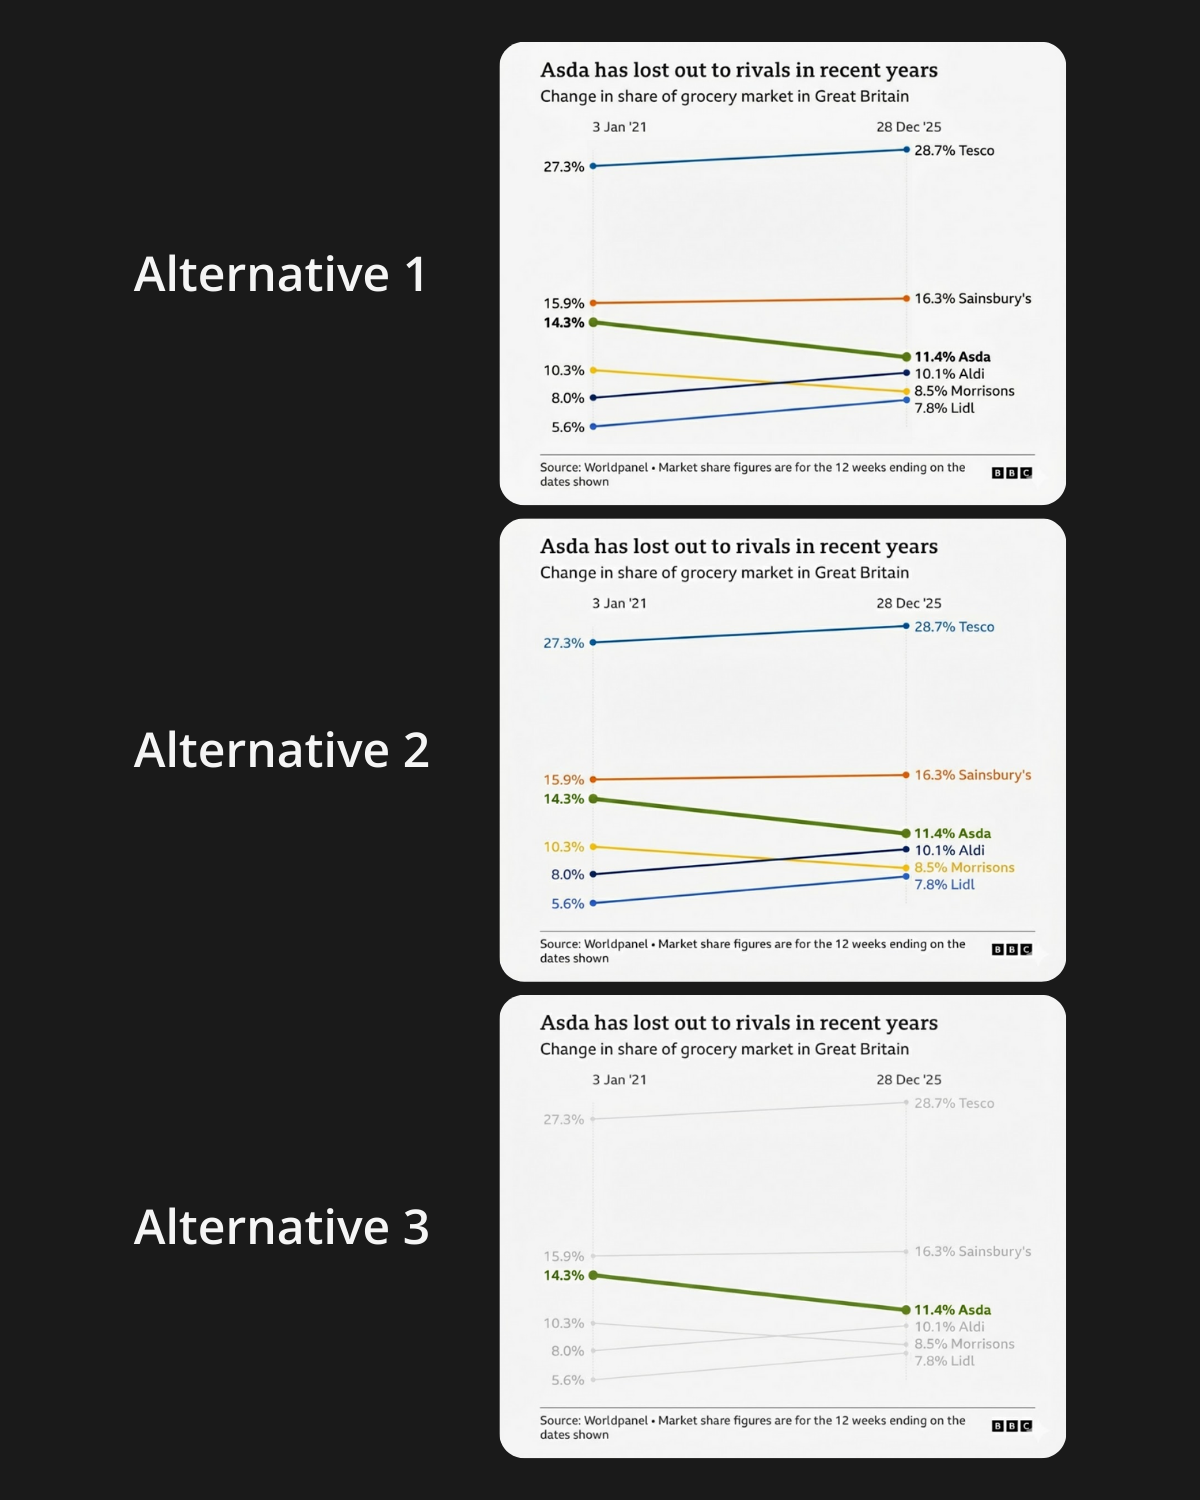
Alternatives 1 and 2 are quite similar, but the latter goes a step further by colouring the labels to match their lines, which makes it easier to identify each supermarket on both the left and right without having to trace the lines.
Alternative 3 is conceptually very similar to the original chart, but uses green for the line of focus instead. This approach works if the intention is to place heavy emphasis on Asda, but overall Alternative 2 feels like the best choice for clarity and instant recognition.
Agree?


