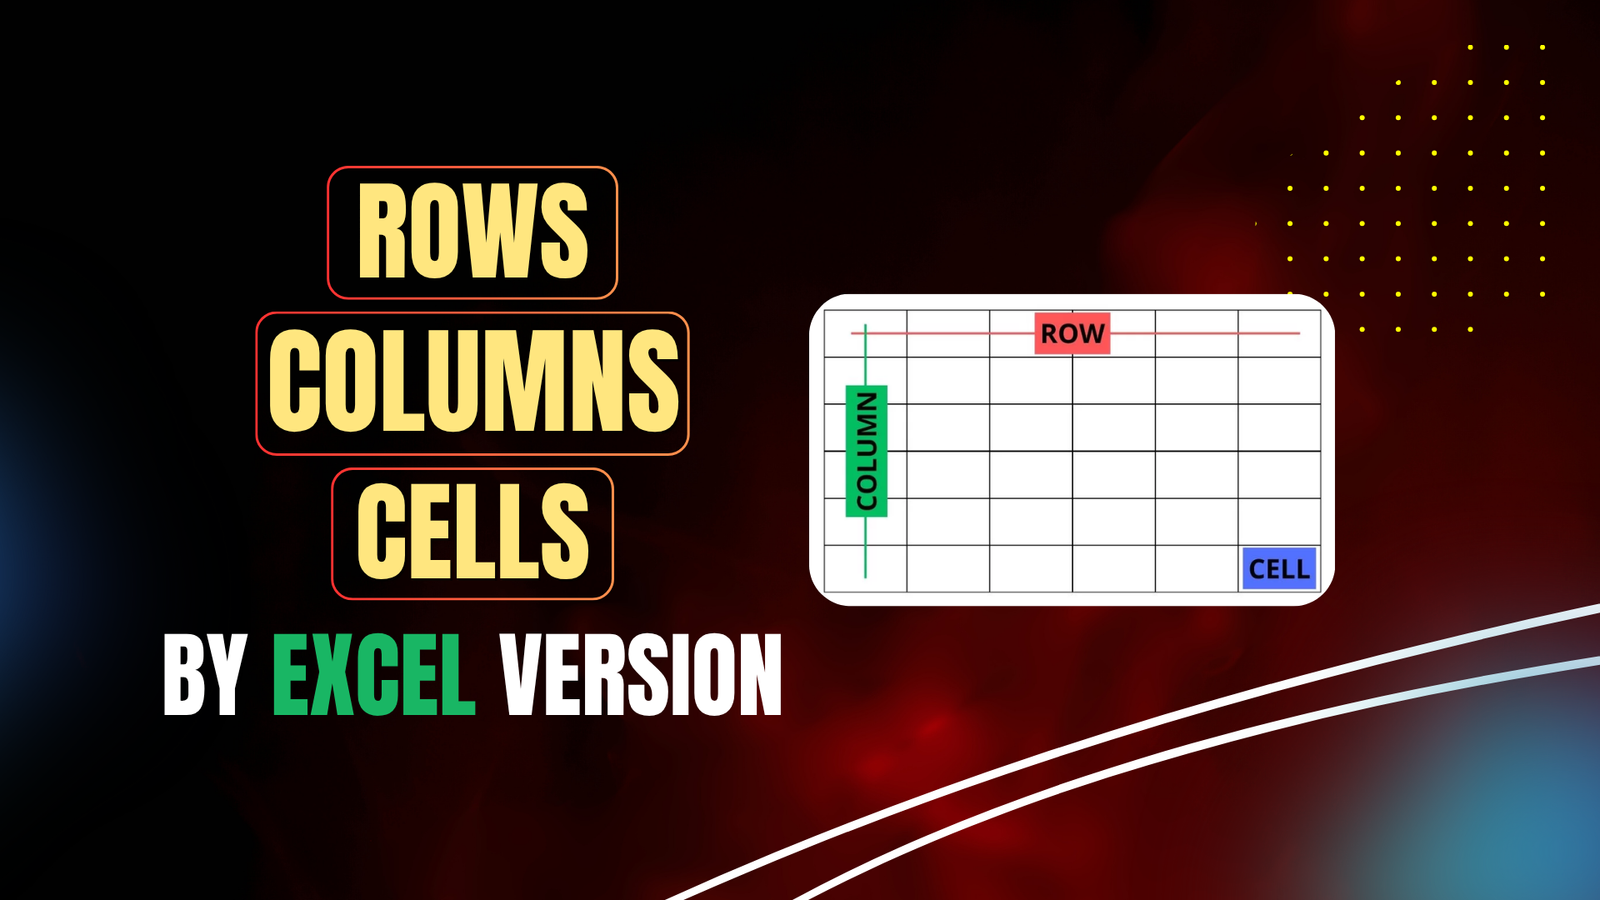
Rows/columns/cells by Excel version (Windows)
For over 15 years, the bedrock of an Excel worksheet has been its 1,048,576 row by 16,384 column grid to house our data, formulas, tables, and charts.
It wasn’t always this way. Prior to Excel 2007, only 65,536 rows and 256 columns were present in versions as far back as Excel 97. And before then, it was the same number of columns and 16,384 rows.
To put this into context, the world’s inaugural spreadsheet program, VisiCalc, was based on a 254 x 63 grid.

Just because a version supports a certain number of rows and columns, the actual amount saved is determined by the file type. XLSX has been the standard format since 2007 and supports the maximum. Its predecessor, XLS, truncates anything outside the first 65,536 rows and 256 columns.
Try telling that to Public Health England, who made a right pig’s ear of their COVID-19 test results system, having misplaced 16,000 coronavirus cases because of their reliance on the archaic format.
Anyway, I digress.
Excel has two versions: 32-bit and 64-bit. The key difference is how much memory each can access, which becomes significant when you demand greater performance from your bloated workbooks.
In theory, 32-bit can only handle up to ~4 GB of RAM, whereas for 64-bit, it’s ~16 exabytes (~16 billion gigabytes)!
Excel 95 was the first major 32-bit version, and this continued until Excel 2010, when 64-bit became an alternative. As computer technology evolved over the subsequent decade, Excel 2019 saw 64-bit finally take charge as the default installation.
Contrary to popular belief, it’s possible to load large datasets into Excel that stretch well beyond worksheet limitations thanks to the Data Model. However, these can only be used by PivotTables and PivotCharts. Worksheets can’t magically expand, unfortunately.
A million rows seems increasingly minuscule in a world of big data. While it’s a lot for most intents and purposes, some of us are working with huge amounts of data we’d like to analyse. PivotTables and PivotCharts do not give us the flexibility of formulae.
Along with greater computational power, the new calculation engine implemented three years ago has made Excel bigger, better, faster, and stronger.
So why do we have the same limits as 15 years ago?
It’s time for an upgrade.


