How to replicate Sheets’ FLATTEN function in Excel

Wednesday’s announcement of 14 new Excel functions was welcoming news.
However, despite switching to the BETA Channel yesterday, I am not one of the lucky ones who have access to the new batch yet.
Nevertheless, I was particularly drawn to the TOCOL function, which appears to be Excel’s answer to Google Sheets’ FLATTEN.
FLATTEN flattens all the values from one or more ranges into a single column.
There have been numerous occasions over the years where I’ve wanted to do this in Excel but haven’t been able to (easily) due to the lack of native function. Thankfully, in more recent times, it’s been possible to create a LAMBDA that largely replicates it.
It’s going to be a while before TOCOL has widespread availability, so in the meantime, use FLATTEN!
Function Syntax
FLATTEN ( array )• array — the array or reference to return as a column
Example
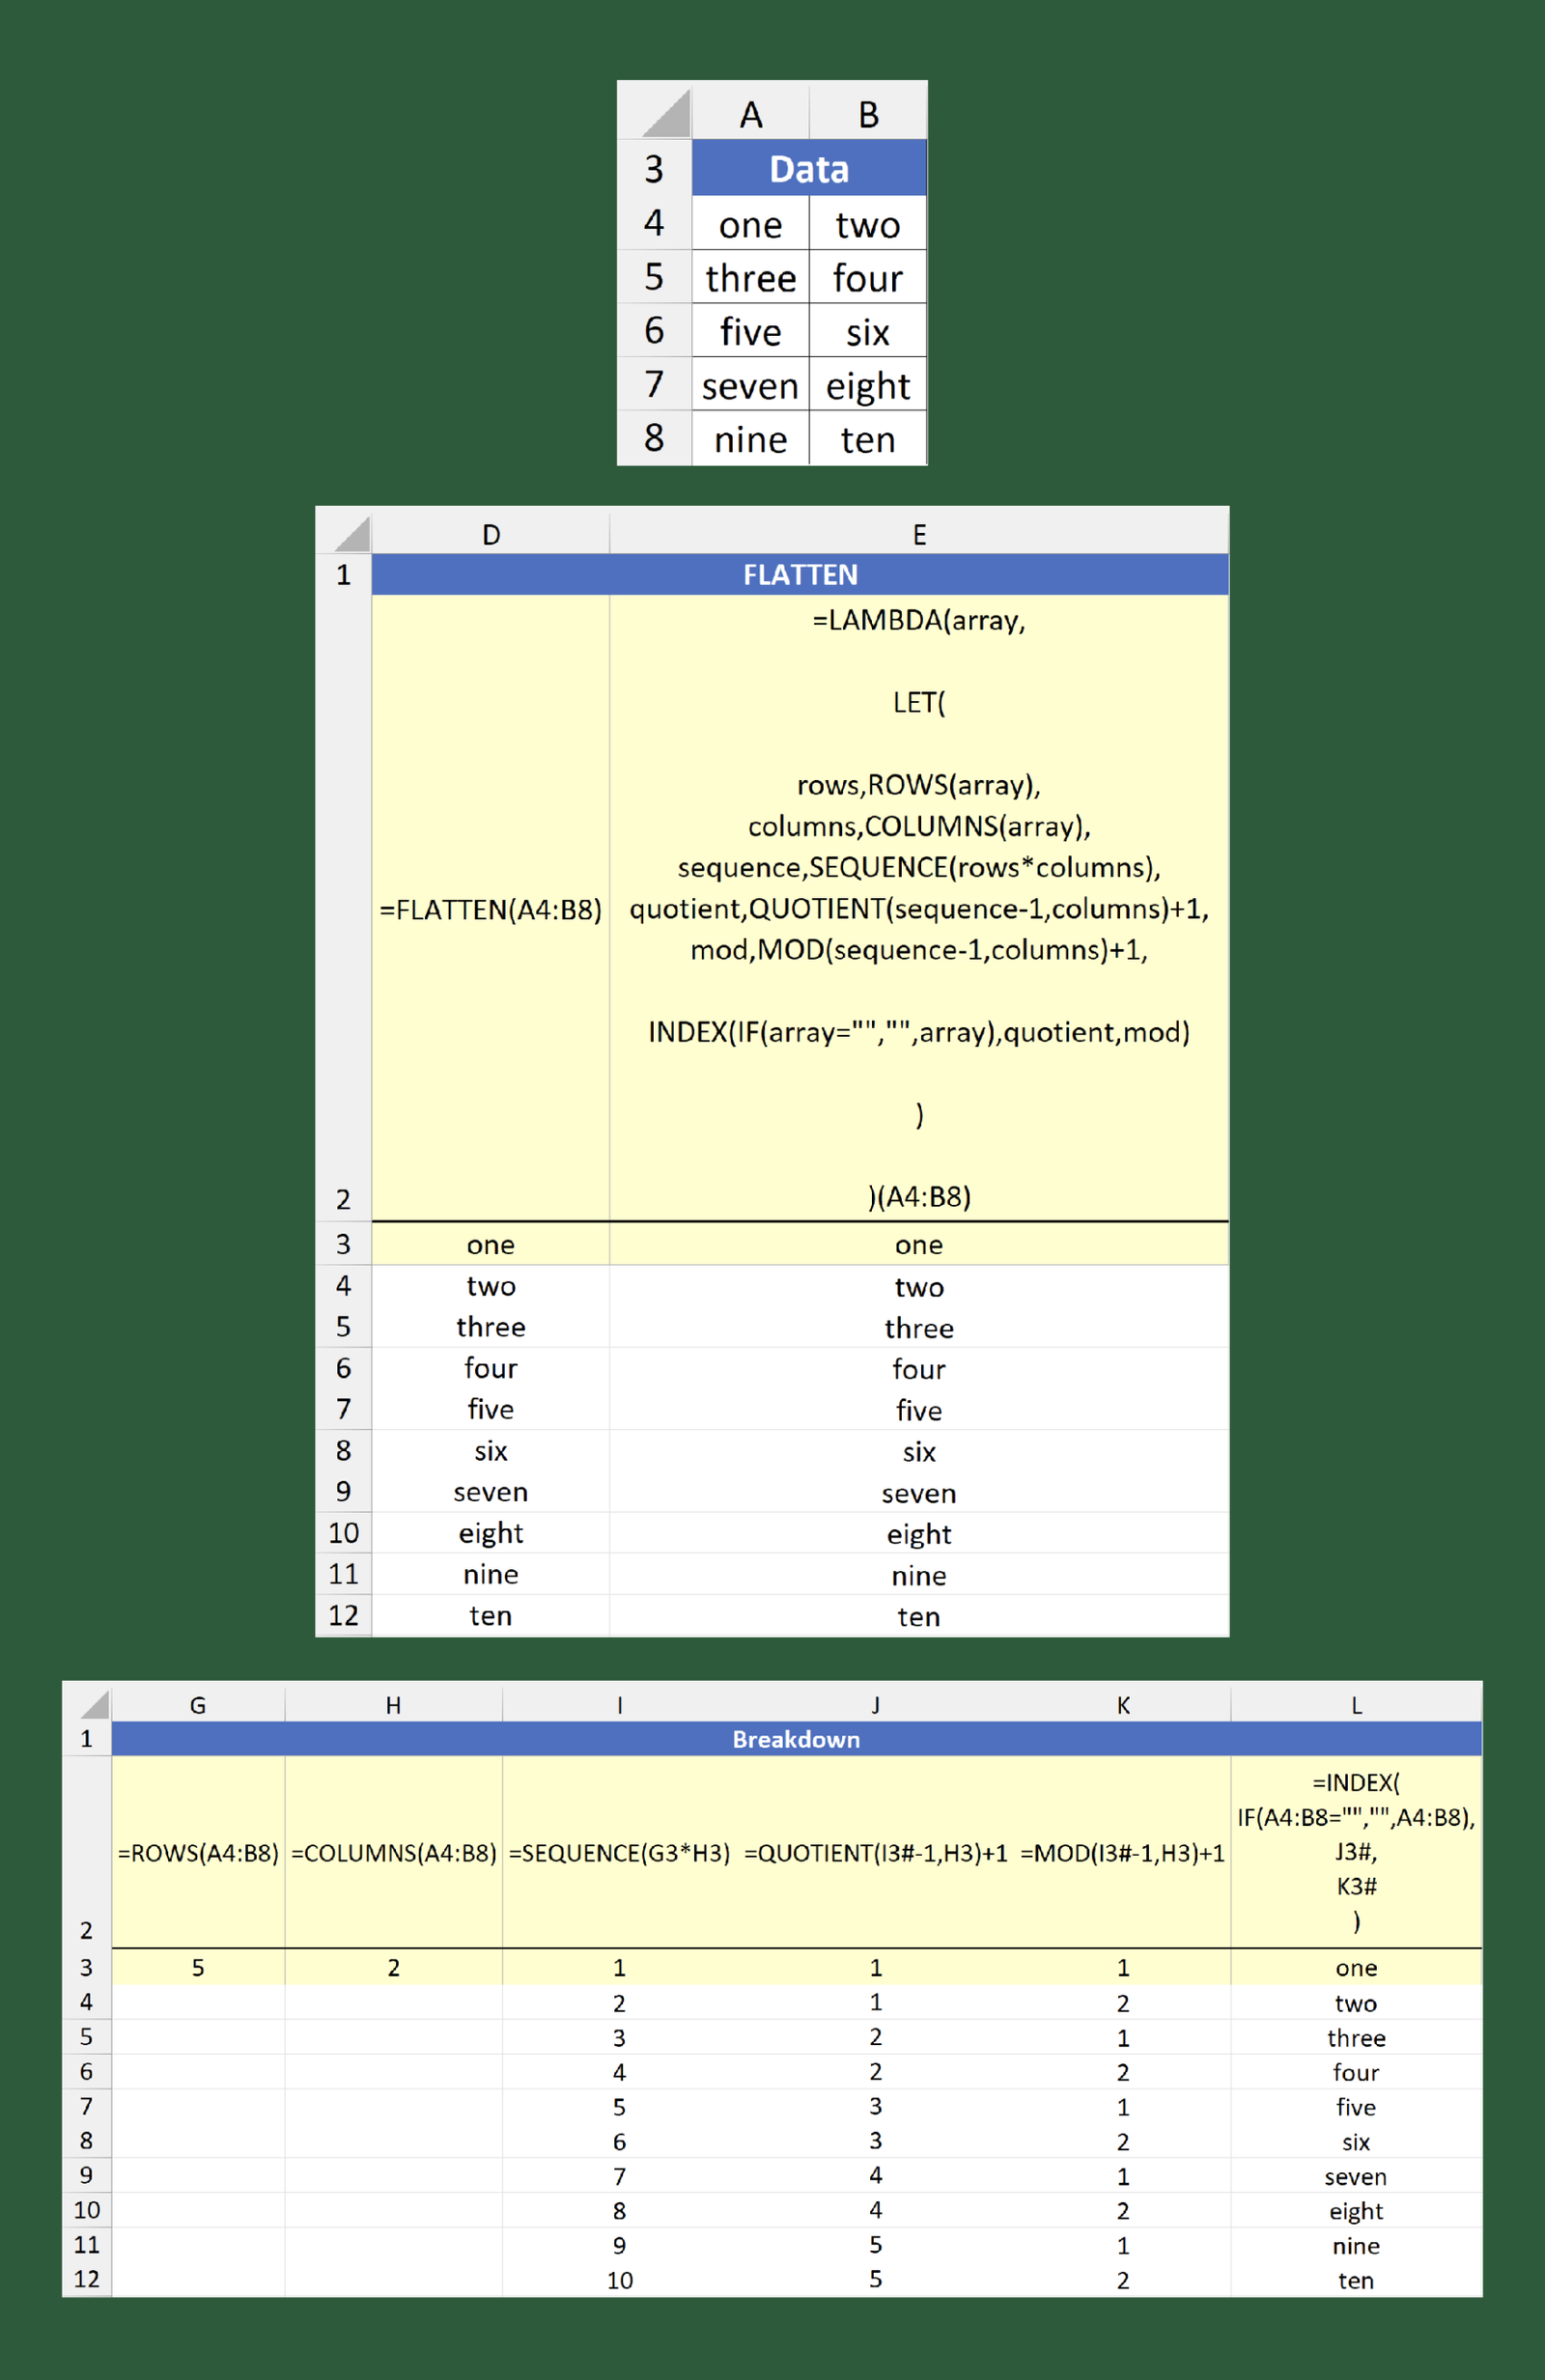
Cell D3 uses FLATTEN to reference the Data table values, which contains the numbers 1–10 spelt out. E2 shows the function’s composition, and each part is broken down in columns G to L.
The following named values are stored inside LET:
• rows — 5 rows in the Data table.
• columns — 2 columns in the Data table.
• sequence — multiplies the Data table rows by its columns to create a sequence of numbers from 1 to 10.
• quotient — QUOTIENT returns the integer portion of a division. In numerator, 1 is subtracted from each of the sequence figures. These are then divided by 2 (columns) in denominator and 1 is added to generate an array with two of each row number, e.g. 1, 1; 2, 2; 3, 3, etc.
• mod — MOD returns the remainder after 𝚗𝚞𝚖𝚋𝚎𝚛 is divided by divisor. The calculation is the same as quotient, except the result consists of an alternating 1 and 2.
With the named values defined, the main calculation can now be constructed (column L).
Nested inside the INDEX array argument is an IF statement ensuring any blank values in the Data table are returned as empty strings.
The quotient and mod values in columns J and K represent row_num and [column_name], respectively. This pattern of numbers allows the correct values to be grabbed from the Data table and displayed in a single column.
Limitations
Unfortunately, certain disadvantages do exist compared to Google’s FLATTEN. Non-contiguous ranges are not permitted, so all columns must be adjacent to each other. That also means different-sized ranges are forbidden.
From my understanding, TOCOL does not have these limitations.
Anyway, if you don’t have TOCOL either, find the code for my FLATTEN function at: